7 Quality Control KPIs That Actually Matter
7 quality control KPIs that actually matter
In the food industry, managing quality without hard data is like driving with your eyes closed. Quality control KPIs are the compass that lets quality managers make informed decisions, catch deviations before they become bigger problems, and demonstrate the department's real value to leadership. But not all indicators are equally useful: choosing the right ones is what separates a reactive management system from a truly preventive one.
What is a quality KPI and why measure it
A quality KPI (Key Performance Indicator) is a quantifiable metric that reflects the performance of processes related to food safety, compliance, and continuous improvement at a food company. It's not about piling up data for its own sake, but about selecting the quality indicators that genuinely guide decision-making.
Measurement is the foundation of any solid management system. As established by Regulation (EC) No 178/2002, laying down the general principles and requirements of food law (Regulation [EC] 178/2002, 2002), food business operators must ensure traceability and control at every stage of production, processing, and distribution. Without well-defined indicators, meeting this requirement becomes almost impossible.
Food quality KPIs also make it easier to communicate with other departments and senior management, since they translate the technical complexity of quality work into figures that are easy to understand and compare. They're also essential during internal and external audits, where numerical evidence is indispensable.
The 7 essential quality control KPIs
Below are the seven indicators that every quality manager in the food industry should track systematically.
1. Number of non-conformities logged
This indicator measures how many deviations from defined standards occur in a given period. It can be broken down by area, process, or issue type. A sustained rise in non-conformities signals that something isn't working correctly in the system; a steady decline shows that corrective measures are paying off.
2. Average non-conformity resolution time
Detecting problems isn't enough — you have to resolve them quickly. This KPI measures the time between opening a non-conformity and effectively closing it. Long resolution times can point to bottlenecks in assigning responsibility or implementing corrective actions. Reducing this indicator is key to minimizing the impact of deviations on production and product safety.
3. Issues per batch or reference
This quality indicator relates the number of issues detected to each product batch or reference. It helps identify whether problems are concentrated in specific raw materials, certain production lines, or particular suppliers. It's especially valuable for directing improvement efforts toward the highest-risk points.
4. Audit compliance rate
Measures how well audited processes and procedures meet established requirements, whether internal or derived from standards such as ISO 22000 and ISO 9001 (ISO, n.d.). A high compliance rate reflects a mature management system; a low one highlights priority areas for improvement. This KPI also allows you to compare progress between audit cycles and justify investment in training or resources.
5. Customer complaint rate
Complaints are a valuable source of external information. This KPI measures the number of complaints received relative to the volume of product delivered or sold. A high rate can point to failures in final quality control, labeling, the cold chain, or allergen management, among other factors. Reducing it has a direct impact on customer satisfaction and company reputation.
6. Corrective action effectiveness
Not every corrective action permanently eliminates the problem. This indicator measures what percentage of implemented actions effectively resolved the non-conformity, with no recurrence within a defined period. Low effectiveness suggests that the root cause analysis isn't thorough enough or that the solutions adopted don't address the underlying problem.
7. Percentage of records completed on time
Control records — temperatures, cleaning logs, CCP checks, analytical controls — are the backbone of quality documentation. Measuring what proportion of these records is completed within the set deadline helps detect gaps in operational discipline and act before an audit exposes documentation shortfalls.
How to set realistic targets for your quality metrics
Setting targets is just as important as choosing the indicators. A poorly calibrated target can frustrate the team or, at the other extreme, create a false sense of control. To set realistic goals, it's worth following these criteria:
Start from your current baseline. Before setting a target, analyze the last six to twelve months of history. Without reference data, any goal is arbitrary.
Apply the SMART methodology. Targets should be specific, measurable, achievable, relevant, and time-bound. For example: "Reduce the average non-conformity resolution time from 12 to 8 days next quarter" is a SMART goal; "improve quality" is not.
Involve operational teams. Production, logistics, and maintenance managers are key players in meeting food quality KPIs. Defining targets together builds commitment and makes it easier to identify real barriers.
Review and adjust periodically. A target that felt ambitious six months ago may already be outdated after a new production line goes live or a supplier changes. Quarterly or half-yearly reviews keep KPIs aligned with operational reality.
How to automate KPI tracking with dashboards in Solved
The biggest obstacle to effectively tracking quality indicators isn't a lack of data — it's the time it takes to collect, organize, and present it usefully. When records are managed on paper, in spreadsheets, or scattered across emails, building reports becomes a manual, error-prone task that can eat up hours every week.
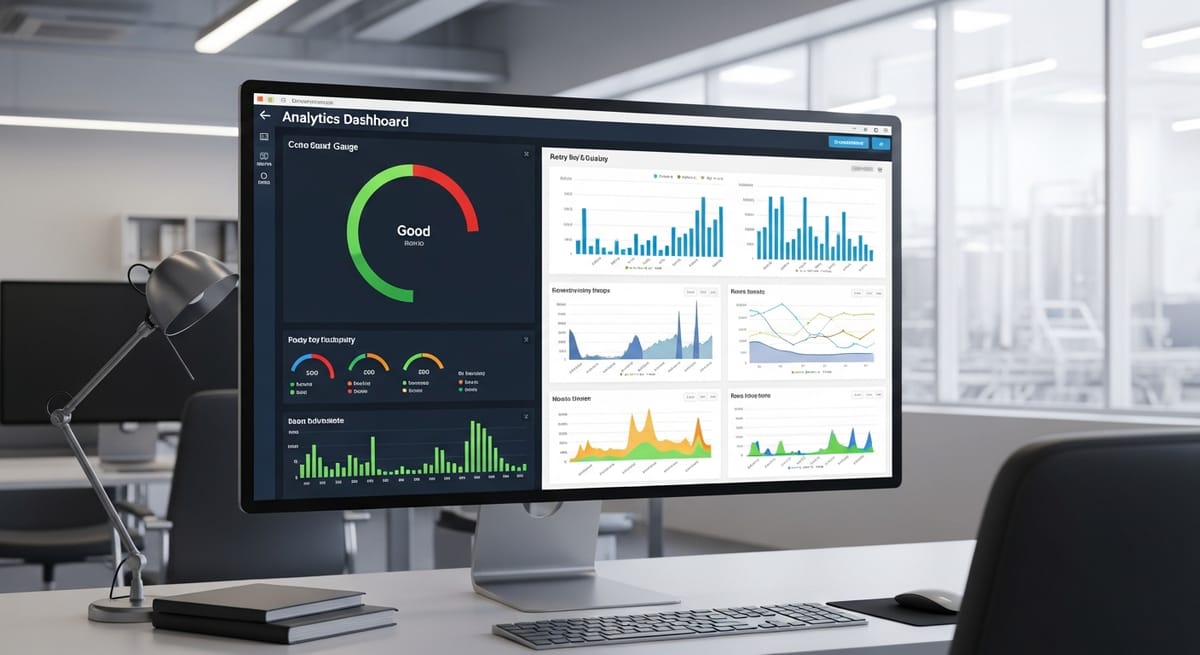
Solved offers a digital environment built specifically for the food industry, where all quality data is centralized and turned into actionable information. Through its dashboard module, you can view the status of the most relevant KPIs in real time: open non-conformities, resolution-time trends, record completion rates, or issues per batch, among others.
Thanks to automated quality reporting, managers no longer spend time building tables and charts by hand. The system automatically generates periodic reports, with up-to-date data ready to share with leadership or present in an audit. This doesn't just save time — it also reduces the risk of human error and guarantees the traceability of the information.
The key isn't having more data, but having the right data, organized and accessible exactly when you need it. With the seven quality control KPIs described in this article and a tool like Solved to automate their tracking, your quality department can move from firefighting to leading continuous improvement with solid evidence.
References
- International Organization for Standardization. (n.d.). ISO 22000 and ISO 9001. https://www.iso.org/
- Regulation (EC) No 178/2002 of the European Parliament and of the Council of 28 January 2002 laying down the general principles and requirements of food law. (2002). https://eur-lex.europa.eu/eli/reg/2002/178/oj?locale=es