Real-Time Quality Dashboard
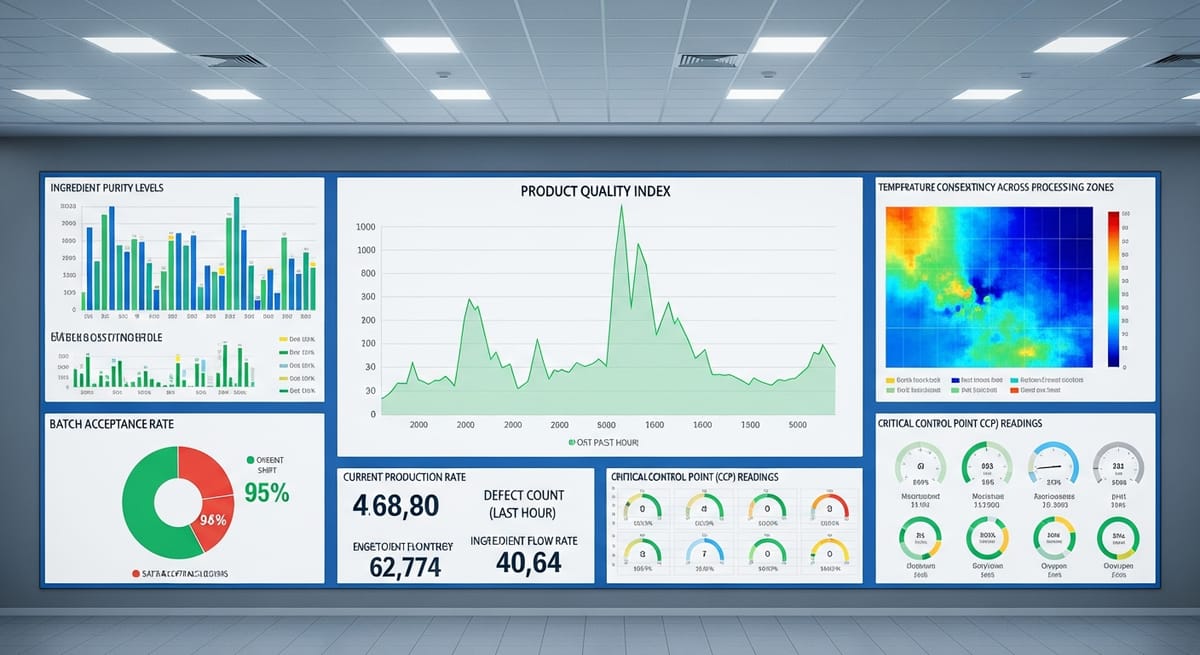
Real-Time Quality Dashboard: Act Before the Problem Escalates
In the food industry, information that arrives late is useless. A real-time quality dashboard changes the rules of the game: instead of discovering a deviation after the batch has already left the plant, you see it the moment it happens and can act immediately. If you're still managing your indicators in spreadsheets or through weekly reports, this article is for you.
What a quality dashboard should show
A good quality dashboard isn't a screen full of numbers. It's a decision-making tool. To do that job well, it has to show exactly what a quality manager needs to see at a glance, without having to cross-reference data from different sources.
These are the essential elements it can't do without:
- Status of critical control points (CCPs): if any parameter goes out of range, it should be the first thing you see, with an immediate visual alert.
- Inspection and audit results: conformity rate, open issues, and how long they've been open.
- Non-conformity log: how many there are, which area they're concentrated in, and their resolution status.
- Batch traceability: the ability to know, in seconds, where each batch is and which checks it has passed.
- Hygiene and cleaning indicators: completed verifications versus planned ones, microbiological analysis results.
- Customer complaints: how they evolve over time, categorized by defect type.
The key is having all this data centralized and updated in real time, not exported manually every Monday morning.
Indicators that actually move the needle
One of the most common mistakes when designing a quality dashboard is including too many indicators. More isn't always better. The real-time quality KPIs that genuinely add value are the ones directly tied to food safety risks or customer satisfaction.
Before choosing your indicators, it's worth remembering that European law requires operators to establish, implement, and maintain procedures based on hazard analysis principles, as set out in Regulation (EC) 852/2004 on the hygiene of foodstuffs (Regulation [EC] 852/2004, 2004). This means these indicators aren't optional — they're evidence that your system works.
With that in mind, here are the real-time quality KPIs that have the biggest impact on day-to-day operations:
- Non-conformity rate by line or process: tells you objectively where failures are concentrated.
- Average issue closing time: a high figure signals that your management system isn't agile.
- Percentage of checks completed versus planned: measures your teams' operational discipline.
- Complaints per 100,000 units produced: the indicator that most directly connects internal quality with customer experience.
- Trend of analytical results: microbiological or physicochemical trends that can flag problems before they turn into alerts.
- Corrective action effectiveness: percentage of corrective actions that resolve the problem without recurrence.
An effective dashboard doesn't just show the raw number — it puts it in context: compared with the previous period, against the target, and against the trend of the past few weeks.
From record to KPI, no spreadsheets required
The biggest bottleneck for most food companies isn't a lack of data — it's the difficulty of turning that data into useful information. The usual cycle goes something like this: the operator logs something on paper or in an Excel file, someone transcribes it into another document, the quality manager consolidates and calculates it manually, and the report lands two days after the problem occurred.
This model has three structural problems: it introduces errors at every handoff, it eats up hours that could be spent analyzing instead of copying, and the information it produces is always in the past.
The alternative is to digitize the record at the source. When data is entered directly into the system — from a tablet on the line, a connected sensor, or an integrated measuring device — the KPI is calculated automatically and the dashboard updates instantly. No middlemen, no waiting, no transcription errors.
A digital system also lets you set up automatic alerts: if a temperature exceeds the critical limit, the responsible person gets a real-time notification, not one that arrives during the next data review round. This matters especially in light of the EU General Food Law (Regulation [EC] 178/2002, 2002), which requires operators to withdraw any unsafe food from the market and notify the relevant authorities. Detecting problems sooner means reacting sooner and, ideally, keeping the problem from ever reaching the consumer.
How to build automatic dashboards in Solved
Solved is designed specifically so that quality managers in the food industry have their dashboard up and running from day one, with no coding and no dependency on the IT department.
Setting up a quality dashboard in Solved follows three simple steps:
- Digitize your control forms: Solved includes a library of standard forms tailored to the industry — CCP checks, cleaning verifications, product inspections, internal audits — that you can customize to fit your process. Operators fill them out from any device, no paper involved.
- Define your indicators: in the configuration panel, select which metrics you want to monitor, set your targets, and define alert thresholds. Solved calculates the KPIs automatically from the records entered, with no manual formulas.
- Turn on automated quality reporting: schedule automatic generation of daily, weekly, or monthly reports sent directly to the people who need them. No manual exports, no emails with Excel attachments.
The result is a dashboard that updates in real time every time someone enters a data point, with clear status indicators, trend charts, and configurable alerts. Quality managers can tell at a glance whether the day's operation is within parameters or whether something needs immediate attention.
Solved also centralizes all related documentation: if a KPI turns red, you can go straight to the record that triggered it, the control point's history, and any open corrective actions. Everything connected, everything traceable.
If you want to stop managing quality by looking in the rearview mirror and start making decisions with real-time information, Solved's real-time quality dashboard is the place to start. Request a demo and see how it works applied to your actual process.
References
- Regulation (EC) No 178/2002 of the European Parliament and of the Council of 28 January 2002 laying down the general principles and requirements of food law. (2002). https://eur-lex.europa.eu/eli/reg/2002/178/oj?locale=es
- Regulation (EC) No 852/2004 of the European Parliament and of the Council of 29 April 2004 on the hygiene of foodstuffs. (2004). https://eur-lex.europa.eu/eli/reg/2004/852/oj?locale=es